
INTRODUCTION
Glaucoma encompasses a group of neurodegenerative diseases characterized by progressive atrophy of the optic nerve (CN II). According to the World Health Organization (WHO), it will affect over 111 million people in 2040, making it one of the leading causes of blindness in the world [1]. Glaucoma can be identified by its characteristic optic disc changes and corresponding visual field defects caused by retinal ganglion cells (RGC) death. The main modifiable risk factor for glaucoma is increased intraocular pressure (IOP). However, the disease can develop in eyes with normal IOP, and lowering the pressure value does not always prevent the progression of the disease. The lack of a direct correlation between IOP and the appearance of disease symptoms may suggest that there are mechanisms independent of the elevated IOP that can be diagnostic markers of glaucoma [2, 3]. These processes are similar to the mechanisms that have been described in other neurodegenerative diseases. Neurodegenerative diseases are characterized by a loss of specific populations of neurons, often leading to impaired oculomotor control, such as Alzheimer’s disease, mild cognitive impairment [4, 5], Huntington’s chorea [6], and Parkinson’s disease [7]. Changes in the fixation pattern are different amongst these diseases, which may have prognostic and diagnostic significance. Previous post-mortem and in vivo studies indicate that eye movements can be a source of valuable information. Eye movement abnormalities may be one of the first symptoms of these diseases. Glaucoma as a neurodegenerative disease is an important working hypothesis allowing for a better understanding of the neuronal damage to the visual system [2]. Therefore, the question can be posed: Can changes in the mobility of the eyes also be one of the first symptoms of glaucoma?
Neuronal degeneration in glaucoma
Glaucoma-related damages occur not only within the eye but also beyond it because not only do the nerve fibers of the retina degenerate, but also the nerve fibers that make up the CN II, optic tracts, and nerve cells that make up the further layers of the visual pathway [3]. The pathogenesis of glaucoma consists of a gradual vision loss as a result of RGC death, as well as atrophy and degeneration of axons extending to the visual centers of the brain [3, 8, 9]. Retinal ganglion cells are neurons within the ganglion cell layer (GCL) that receive visual information generated by photoreceptors via bipolar, amacrine, and horizontal cells. The RGC axons, which initially run on the surface of the retina as they leave the eye, become myelinated to form the CN II and converge at the optic chiasm, where the fibers that supply the nasal hemispheres of both eyes’ retinas cross. Then they become the visual pathways that connect the eye to the central nervous system (CNS) [3]. The optic tracts mostly reach the lateral geniculate nucleus (LGN). Visual signals sent from the retina to the LGN via the CN II connect to neurons in the primary visual cortex (V1) [10, 11]. Loss of RGC axons significantly affects visual functions, leading to impaired peripheral vision and reduced sensitivity to contrast, making it difficult to perform everyday activities [12, 13]. It is only after axonal degeneration that the RGC bodies and their connections to visual processing are lost, which in the most severe cases, can lead to disturbances in brain structures.
Retinal ganglion cells
Almost 30 different morphological types of RGCs have been recognized in the human retina, but only some of them are considered essential for the functioning of the three different visual pathways [14]. The LGN consists of six main layers. Dorsal layers 1 and 2 receive input mainly from magnocellular (M) cells, also known as umbrella cells. They make up about 5-15% of all RGCs and form the M pathway, which receives projections from the rods. Ventral layers 3, 4, 5, and 6 receive input mainly from parvocellular (P) cells. They account for about 80% of all RGCs and form the P pathway receiving projections from the cones [15]. The third visual pathway is located between the main laminae of the LGN and consists of koniocellular (K) bistratified cells, which form the smallest K pathway, which has not been sufficiently studied so far [16]. More recently, additional melanopsin-containing RGCs (mRGCs) have been identified. They account for about 1% of all RGCs and form the retinohypothalamic tract [15]. Studies conducted so far have shown significant structural and functional differences between the three main retinal visual pathways in both animals and humans. M cells have large cell bodies, thick axons, and broad, radially branched dendritic trees. In contrast, P cells have small cell bodies, thin axons, and narrow dendritic trees with more dense branching [17]. K cells are characterized by a larger diameter of the dendritic field than P cells, but a much smaller one than M cells [18]. Therefore, to facilitate their recognition, they can be called medium cells. The size of the neuron of each RGC correlates with the diameter of the axon [10]. M cells have a higher conduction speed and a larger receptive field compared to P cells. They are characterized by a high sensitivity to moderate to fast-moving stimuli and changes in contrast, but they react poorly to changes in color or detail of a fixation target [19, 20]. P cells primarily respond to color changes, transmitting signals in opposition to the red and green colors [21], and react poorly to contrast changes. K cells have an intermediate conduction velocity and a very large receptive field. They respond moderately to changes in contrast and react to color changes, transmitting signals in opposition to blue and yellow [22]. Lesions involving the M layers impede the perception of movement, while damage limited to the P layers distorts color and shape processing.
Damage to the retinal ganglion cells in glaucoma
The development of optical coherence tomography (OCT) has made it possible to segment the inner layers of the retina and visualize the thickness of the ganglion cell complex (GCC), covering all three innermost layers of the retina that are potentially exposed to glaucomatous damage. These include the retinal nerve fiber layer (RNFL), the GCL, and the inner plexiform layer (IPL), which successively form the axon, cell nucleus, and RGCs dendrites [23]. In glaucoma, disturbed blood flow within the CN II and, in most cases, increased IOP, leads to neuronal damage through hypoxia, axoplasmic transport disorders, or the action of local tissue mediators and neurotransmitters (e.g., glutamate), resulting in RGCs apoptosis. For the proper functioning of the RGCs, a constant supply of neurotrophins is necessary, which regulate the development of the nervous system and prevent neuronal degeneration [24]. During the RGCs death cycle, dendrites in the inner convolutional layer, responsible for collecting synaptic signals, are the first to disappear [9, 25-27]. Then, microtubules disappear inside the axons, leading to their progressive disappearance [28]. The last to degeneration is the cell body [3].
Previous studies related to the analysis of the number and diameter of RGCs hypothesized that glaucomatous injury is associated with a greater loss of large RGCs and their axons, which initially received considerable support [29-32]. To determine whether glaucoma selectively damages a particular optic axon size, Quigley et al. induced chronic experimental glaucoma in one eye of ten monkeys. Using automated image analysis, they compared the number and diameter of the CN II axons in each eye with glaucoma and in each non-glaucoma eye. Axons larger than the average diameter atrophied faster in eyes with glaucoma, but it is worth noting that no axons size was free from damage [29]. In 1989, Quigley conducted a study in which he measured the number and size of RGCs in human eyes with glaucoma. He showed that fewer M cells remained in the atrophied areas of the retina. In addition, in the same study, he detected an early loss of another ganglion cells, the K cells. Quigley’s hypothesis was confirmed by the results of studies by Glovinski and colleagues conducted on monkeys in 1991 and 1993. Large RGCs were significantly more susceptible to injury at any stage of glaucomatous damage [31, 32]. In 1993, a post-mortem study of human LGN in glaucoma patients by Chaturvedi et al. also showed a selective loss of neurons in the layers receiving input from large M cells [33].
The results of these studies were a significant step in understanding the mechanisms of RGCs apoptosis and were clinically relevant. Psychophysical tests appropriately matched the properties of the RGCs and gave the prospect of diagnosing very early signs of glaucoma. It is worth adding, however, that later research was not entirely consistent with the hypothesis put forward years ago. They argued that the loss of RGCs in glaucoma is not selective but results from the shrinkage of each type of RGCs, leading to apoptosis [34, 35]. To determine whether large M cells are selectively lost in a primate model, Morgan et al. induced elevated IOP in primates. Retinal ganglion cells were retro-labeled with a horseradish peroxidase tracer implanted into the CN II and then tested in whole-body retina preparations. The degree of RGCs loss was assessed based on Nissl-stained tissue compared to the contralateral, untreated control eye. Linear regression analysis showed no significant reduction in the ratio of M cells to P cells loss [34]. In addition, more and more studies have begun to confirm that the morphological changes of RGCs in glaucoma affect not only their axons but also the dendrites. In 1998, Weber et al. combined a monkey model of glaucoma with intracellular staining techniques using an isolated retinal preparation. M and P cells from healthy and glaucoma eyes were intracellularly labeled and their axons, somas, and dendritic fields were compared using a confocal microscope. In both types of RGCs, the earliest signs of compression-induced degeneration involved the transformation of the dendritic structure. The reduction in axons thickness occurred later, and changes in cells body size occurred simultaneously or slightly later. Chronic IOP elevation significantly reduced the mean cells body size of M and P cells, but only M cells showed a significant reduction in their dendritic field size and axons diameter [9, 25]. Psychophysical studies comparing the responses of the M and P pathways have produced conflicting results. Some of them indicated similar dysfunction of both pathways [36], while others suggested exclusive damage to the large cell’s pathway [37].
Recent studies increasingly indicate that abnormalities in retinal microcirculation and impaired blood flow in the eye have a significant impact on RGCs apoptosis, especially in patients with primary open-angle glaucoma (POAG). Low ocular perfusion pressure can reduce the energy state of the RGCs mitochondria or decrease the flow of nutrients in the axons of the RGCs. Thus, oxidative stress caused by reactive oxygen species leads to the death of RGCs. The available literature does not indicate selective RGCs loss [38-40].
In summary, the hypothesis that larger RGCs are preferentially affected in humans and experimental glaucoma has gained significant support since Quigley et al. in 1987. However, selective M cells damage has been discussed for many years with conflicting opinions. Recent studies on experimental glaucoma have shown that both M and P cells can undergo morphological changes to a similar extent, but the results are inconclusive. These differences show that there is a need for further research to assess the pathogenesis of RGCs in glaucoma.
EYE MOVEMENTS IN GLAUCOMA
Effect of retinal ganglion cell disorder on middle temporal area functions
Now that we know which RGCs can degenerate in glaucoma, we can take a closer look at the path taken by the nerve impulse from the RGCs to the visual cortex. Figure 1 summarizes the main current knowledge about neuronal transmission in the visual system. Nerve impulses flow from RGCs (magnocellular [M], koniocellular [K] and parvocellural [P] cells) to the V1 along the optic radiation, i.e., through the axons of cells whose bodies are located in the LGN. Layer 4 is the entry gate for nerve impulses to the visual cortex of the brain. The axons of the LGN M pathway project data to the 4Cα V1 layer regarding the brightness of the visual scene. They are the basis for the global spatial organization of objects and the perception of movement. The axons of the LGN K pathway project data to the 4A V1. They can respond to moderate-contrast stimuli and be involved in color vision. The axons of the P pathway connect to the 4Cβ V1 layer, projecting data on the length and intensity of the light waves stimulating the cones [10]. It allows the perception of fine details, colors, and large changes in brightness. Thus, the M, K and P visual pathways remain separated up to the V1 level. Then, at the level of cortical processing, their segregation is only partial [19]. The complex network of connections in the visual cortex is dominated by two visual pathways, dorsal and ventral [41]. The M pathway has a greater density in the dorsal optic pathway [19]. It runs from V1 through the thick striated regions of the secondary visual cortex (V2), mainly to the MT area (V5) and the posterior parietal cortex (PPC) [42]. Middle temporal (MT) area receives a major contribution from the M pathway. The P pathway plays a major role in the ventral visual pathway. It runs from the V1, through the thin striations and interstriae regions of V2, mainly to the V4 area, specializing in the visual identification of colors, patterns, and objects, and then to the inferior temporal cortex (IT) [41]. IT receives a major contribution from the P pathway. The K pathway runs from V1 through the thin striations of the secondary visual cortex (V2), mainly to the V4 area.
Figure 1
The visual pathways presented in a schematic form, from the RGCs to the higher levels of cerebral cortex involved in generating eye movements.
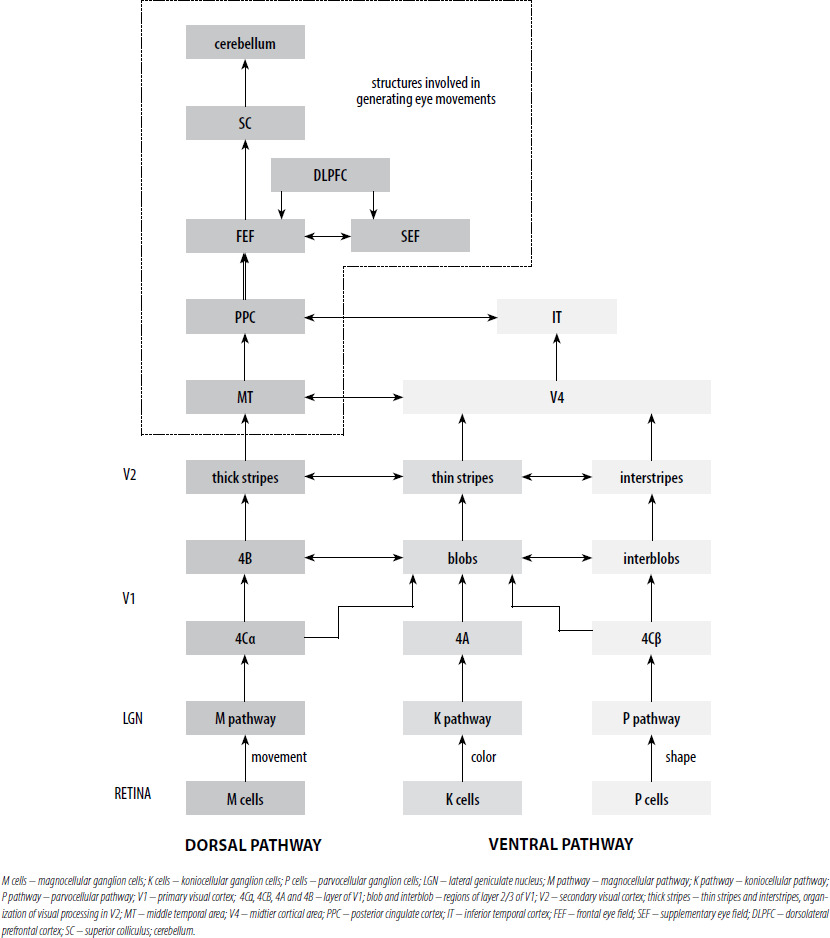
Middle temporal area is a center in the visual system specializing in receiving and processing the movement of a stimulus, and sensory-motor coordination [43]. Its most important outputs target the structures involved in generating eye movements in the frontal lobe. The frontal lobe includes three main areas: the frontal eye field (FEF), the supplementary eye field (SEF) and the dorsolateral prefrontal cortex (DLPFC), involved in eye movement control [44]. For a more detailed characterisation, see section 3.2 and 3.3. All these cortical areas project to the superior colliculus (SC). It is the principal structure sending commands to the brainstem saccade generator. The cerebellum fine tunes all eye movements (saccades, smooth pursuit, vergence, optokinetic and vestibular reflexes) controls eye movements during motion and control voluntary gaze shifting [45-46]. The dorsal and ventral tracts are parallel, but over 300 connections between them are known [47], therefore, they should not be treated as simple extensions of the subcortical streams of the M, K and P tracts. Therefore, disorders in the M, K and P pathways may inhibit the proper functioning of the MT, leading to disturbances in the proper functioning of brain structures, resulting in changes in eye movements. More and more research shows that eye movement data can be a source of important information used in many fields, such as neurology, psychology and ophthalmology. Oculomotor abnormalities can be detected at an early stage of the disease and are a sensitive marker for diagnosing and predicting disease progression in patients. However, changes in eye movements parameters are very sensitive and require very accurate measurements, which are unfortunately limited by commonly available devices. Evidence shows that patients with glaucoma can have changes in several domains of eye movements.
Saccades
Saccades are very fast eye movements, moving at a speed of 100–900°/s. The purpose of saccades is to direct the gaze to the target of interest. Within the frontal cortex, saccades are controlled by three main areas, the FEF, SEF, and DLPFC [49]. Frontal eye field generates saccades in the direction of an emerging target (prosaccades), a target not yet present (predictive saccades), an already invisible target (memory-guided saccades), or in the opposite direction of the target (anti-saccades). This area is least involved in triggering reflex saccades, often called prosaccades, which are triggered towards a suddenly appearing peripheral target and depend mainly on the parietal eye field. In addition, together with the cerebral cortex, the posterior temporoparietal regions, and the cerebellum, the FEF region controls guiding movements. The SEF and DLPFC areas are involved in the decision-making processes, both triggering and inhibiting reflex saccades. In addition, they direct the gaze to a remembered place and produce a sequence of several consecutive saccades [50].
Reflex saccades are typically tested by asking participants to initially focus their gaze on a central fixation point. The fixation point is hidden after a short time, and a new fixation target is presented at a specific angular distance from the central fixation point (7, 10, and 20°). Participants are asked to look immediately at the peripheral target and then at the central fixation point when it reappears. All of the studies described below used this technique or a variation of it. The protocols included a moving peripheral target (appearing at speeds of 2–10°/s), a static target, and anti-saccades. After the subjects complete the visual tasks, the authors analyzed the parameters describing the saccades, such as latency, duration, speed, and accuracy.
In 2012, Kanjee et al. conducted a study for the first time in which they assessed the effect of glaucoma on saccadic latency. The task of the subjects was to perform prosaccades, which were recorded using a non-invasive infrared eye tracker. Compared to the control group, subjects with glaucoma had median saccadic trigger times that were significantly prolonged (192.1 ±31.24 ms vs. 220.9 ±49.02 ms, p = 0.036), and the frequency of expressive saccades was significantly reduced (7.0 ±6.99 vs. 1.75 ±2.32, p = 0.007). As glaucomatous lesions advanced, the latency of saccades increased, and their expression decreased [51]. In another study by Najjar et al., patients with POAG showed reduced mean saccadic velocities (p = 0.03), decreased amplitudes (p = 0.007), and made more anti-saccade errors (40.6%) while performing an anti-saccade task compared to the control group (23.4%; p = 0.04) [52].
In the study by Tatham et al., saccadic vector optokinetic perimetry (SVOP) and standard automated perimetry (SAP) were performed to determine the speed and accuracy of saccadic movements in glaucoma patients. The SVOP provided data on threshold sensitivity, the direction of latency, and saccade amplitude. The correlation between eye movement parameters and the severity of glaucoma was investigated. Compared to the control group, patients with glaucoma had significantly retarded saccades (578.3 ±44.6 ms vs. 602.9 ±50.0 ms, p = 0.009) and had lower accuracy in performing saccades (6.5 ±1.5 vs. 7.4 ±1.8°, p = 0.006). During SAP in glaucoma patients, there was a significant slowdown of saccades, which became less accurate as luminance decreases [53]. In 2021, Thepass et al. investigated the correlation between visual field sensitivity and responses in relevant areas of the visual field in healthy subjects and patients with mild, moderate, and severe glaucoma. Subjects went through protocols consisting of 54 eye movement perimetry (EMP) points and the standard 24-2 interactive thresholding algorithm (SITA) using the Humphrey field analyzer protocol. It was shown that the mean saccadic reaction time (SRT) increased with the severity of glaucoma (from 479 ms in the control eyes to 678 ms in patients with advanced glaucoma, p < 0.001) and with an increase in sensitivity loss on SAP [54]. During the same year, Mazumdar published a study in which he confirmed that in cases of a higher degree of glaucoma, tendencies to extend saccades latency were observed [55].
Changes in the saccades have resulted in the development of EMP, based on the natural human reflexes. A subject’s performance is based on saccadic eye movements (SEM), which means the test results include the properties of the oculomotor control system [56]. The most important parameter of detected stimuli is the SRT. Past studies have demonstrated reliable and comparable results between EMP and SAP in terms of ability to detect visual field loss [57]. Eye movement perimetry has potential to become the standard in perimetry for children and adults who have mental or physical limitations to perform conventional perimetry.
In conclusion, patients with glaucoma, based on the severity of the disease, have an increase in latency and a decrease in the accuracy of saccades. In addition, you can notice a lower amplitude and speed and difficulty in inhibiting reflex saccades. Determination of saccade reaction times may become a new functional test for quantifying visual function in patients with glaucoma. Further research is urgently needed to determine the pathological processes involved in delayed saccadic initiation and to assess whether saccadic alteration affects the daily activities of individuals with glaucoma.
Fixation movements
Although the eyes seem to be stationary during fixation, they perform microscopic movements imperceptible to the naked eye. These movements are microsaccades, drift, and tremor. The amplitude of microsaccades does not exceed 1°, but their exact role is not yet well understood. Drift prevents the disappearance of a still image on the retina and is characterized by a slow extension of the gaze point from the fixation center, and a speed of up to 25°/s. Tremor of the eye muscles is a constant movement of the eyeballs during fixation with a speed slower than microsaccades [58]. Fixation is a dynamic process actively controlled by neural mechanisms located in the brain, brainstem, and cerebellum. Abnormal eye movements and fixation instability are likely signs of an inflammatory and neurodegenerative effect on the CN II and the extensive network of central afferent and efferent visual and oculomotor control pathways essential for proper fixation [59-62]. The exact characteristics of fixation movements, saccades, microsaccades, drift, and tremor are presented in Table I.
Table I
Eye movements types
| Eye movements | Amplitude | Duration | Velocity |
|---|---|---|---|
| Fixation | NA | 200-300 ms | NA |
| Saccade | 1-20° | 20-80 ms | 100-900°/s |
| Microsaccade | < 1° | 10-30 ms | 15-60°/s |
| Drift | < 1,5° | 200-1000 ms | 5-25’/s |
| Tremor | < 1’ | NA | <20’/s |
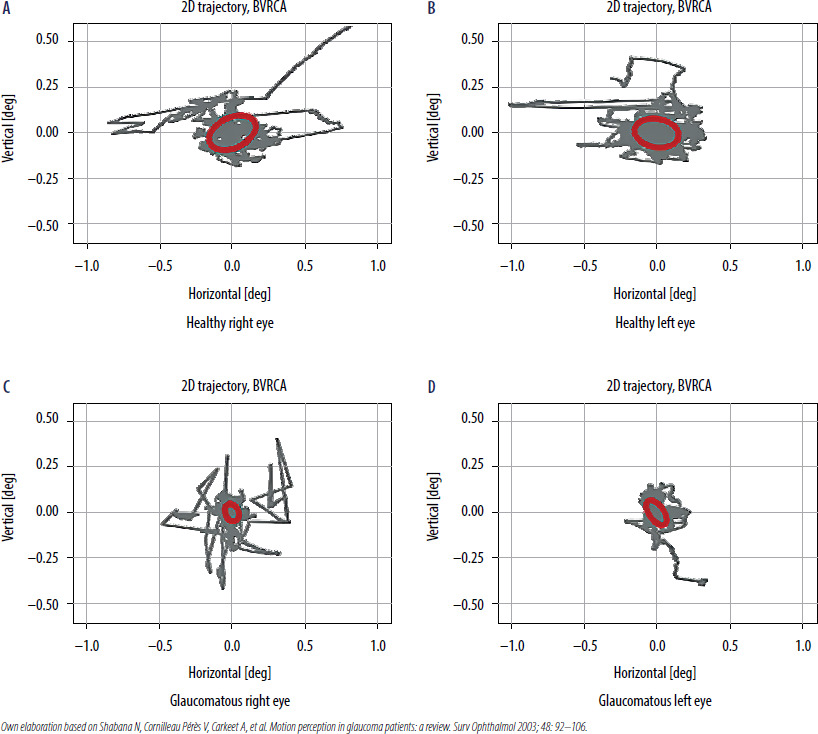
Fixation studies are mainly based on the measurement of its stability, i.e., keeping the gaze on the selected target (Figure 2). The commonly accepted measurements of fixation stability are the assessment of the bivariate contour ellipse area (BCEA) and the Fuji classification. The BCEA is defined as an ellipse that covers 63% (BCEA63) and 95% (BCEA95) of fixation points for a given percentage of eye positions in one fixation attempt, within 1 or 2 standard deviations. This analysis also provides information on the major and minor axes, which are the two orthogonal diameters describing the extent of the fixation points (i.e., horizontal and vertical axis of the ellipse) [60, 63]. The second method calculates the percentage of fixation points (PFP) within the 1° and 2° radius circles (P1 and P2). The main advantage of the method by Fujii et al. is the clinically relevant fixation stability classification. Eyes with a P1 value greater than 75% are classified as having stable fixation. If P1 is less than 75% and P2 is greater than 75%, the fixation is classified as relatively unstable, and if both P1 and P2 are less than 75%, the fixation is defined as unstable [64]. However, this method was questioned in the literature due to the imposition of a fixed measurement area with a radius of 1° and 2° [65]. Of the 2 mentioned methods, BCEA is considered to be more accurate [66, 67].
Figure 2
The trajectory of eye movements of a healthy person (A, B) and a person with glaucoma (C, D) during a fixation task. How the eye “wandered” is marked in gray. The red ellipse denotes the most eye movement area (BCEA). In the glaucoma patient, BCEA was smaller compared to a healthy subject. The abbreviation BVRCA is synonymous with BCEA. The study was conducted using the super-fast eye-tracking device, which was designed and assembled at the Institute of Physics of the Nicolaus Copernicus University in Torun [71].
Literature reviews show that fixation stability measured using commonly available ophthalmic devices can assess retinal function, such as the Nidek MP-1 microperimetry (Nidek, Gamagori, Japan), the Macular Integrity Assessment microperimetry (MAIA-MP, Centervue, Padova, Italy), and the Compass perimeter (Centervue, Padova, Italy). Shi et al., using the MP-1 Nidek, analyzed the fixation data of patients with early and moderate POAG. Significant differences between the groups were observed in fixation stability if the PFP was held within a 2° circle. In the POAG group, a correlation was also observed between fixation stability within 2° (respectively P1 in the MAIA-MP) and the average retinal sensitivity threshold (AT). In early and moderate POAG, patients showed reduced fixation stability correlating with reduced macular sensitivity compared to the controls. In this study, the assessment of fixation indices did not include BCEA analysis [68]. Fixation stability, measured by the spatial distribution covering BCEA95 in the study by Longhin et al., showed no difference between the POAG and control groups [66]. Zabel et al. analyzed fixation stability using MAIA-MP in patients with mild to moderate/severe glaucoma. The obtained fixation parameters were correlated with parameters used to assess retinal function using MP-1 and SAP, and retinal structures using OCT and angio-OCT. Fixation stability in glaucoma patients worsened with increasing disease severity, and significant differences in BCEA95 were observed between the groups (p = 0.042). Quantitative analysis of the structural and functional parameters of the retina also showed significant deterioration with the progression of glaucoma (p < 0.001) [69]. Aswaf et al. [70] also showed that glaucoma stage has impact on the fixation pattern. They examined fifteen glaucoma patients with asymmetric vision loss between eyes. They were asked to monocularly view images of natural scenes, presented sequentially on a computer monitor. Patients’ eye movements were recorded with eyetracker, Eyelink 1000. Eye movement parameters were compared within participants, better eye vs. worse eye. In the worse eye, saccade amplitude (p = 0.012; –13%) and BCEA (p = 0.005; –16%) were smaller, while saccadic reversal rate (SRR) was greater (p = 0,018; +16%). There was a significant correlation between the intereye difference in BCEA, and differences in MD values (Spearman’s r = 0.65; p = 0.01), while differences in SRR were associated with differences in visual acuity (Spearman’s r = 0.64; p = 0.01). Furthermore, between-eye differences in BCEA were a significant predictor of between-eye differences in MD: for every 1-dB difference in MD, BCEA reduced by 6.2% (95% confidence interval: 1.6-10.3%) [70]. The Montesano group proposed an innovative method for the quantitative assessment of the impact of glaucoma changes on fixation movements using the Compass perimeter. Fixation stability was measured by the BCEA using two new measures, mean euclidean distance and sequential euclidean distance (SED). These measurements were designed to capture the spread of fixation points and the frequency of eye position changes during fixation, respectively. The authors reported that the SED index significantly increased in patients with glaucoma during fixation [62].
Existing studies do not agree on exactly how fixational eye movements are altered by glaucomatous visual field loss. The above studies show that fixation stability is impaired in glaucoma, but they are inconclusive. Some of these results may be due to tasks and devices precision differences. The results are promising, and further research is warranted to determine fixational patterns in glaucoma. This approach can become a useful method for diagnosing and monitoring not only glaucoma, but also other neurodegenerative diseases.
CONCLUSIONS
The influence of glaucoma on the mobility of the eye is not well understood. The results of the studies carried out so far are not unambiguous, and many of the eye movement parameters given in the literature are obtained using devices with certain limitations. To date, no standardized protocol or apparatus has been developed that would allow eye movements to be assessed accurately enough to become a diagnostic tool. Therefore, there is a need to develop readily available and inexpensive eye-tracking systems that could accelerate the diagnosis of glaucoma in early stage.