INTRODUCTION
Cataract surgery is one of the most frequently performed ophthalmic procedures [1, 2]. It is estimated that 7 million cataract surgeries are performed annually in Europe, and 20 million worldwide [3]. According to data from the National Health Fund, over 300,000 cataract surgeries were conducted in Poland in 2022 [4]. Widespread access to procedures has led to increasingly high patient expectations. Today, the goal of cataract surgery extends beyond simply removing the opaque lens; it focuses on achieving the best possible visual acuity following the procedure. Objective measures of surgical outcomes include best corrected visual acuity (BCVA) and postoperative refraction [5]. Refractive error is defined as the difference between the predicted and actual spherical equivalent of postoperative refraction [6]. A commonly used parameter in analyses is the absolute prediction error (APE), along with its derivatives: the mean absolute error (MAE) and the median absolute error (MedAE) [7]. A postoperative refractive error is considered significant when the difference between the expected and actual spherical equivalent of postoperative refraction exceeds 1 D [8].
Optimization of refractive outcomes starts with accurate biometry and precise intraocular lens (IOL) power calculation, with non-contact optical biometry being the gold standard [9]. The measurement includes the axial length of the eye and keratometry, with inaccuracies in the latter accounting for approximately 10% of refractive errors after cataract surgery [10]. New IOL calculation formulas incorporate additional factors, such as anterior chamber depth and the predicted effective lens position. Dry eye disease and other ocular surface disorders that disrupt tear film stability are the primary causes of errors in keratometry [11].
The definition of dry eye disease (DED) according to the Tear Film and Ocular Surface Society (TFOS) Dry Eye Workshop II (DEWS II) is “a multifactorial disease of the ocular surface characterized by a loss of homeostasis of the tear film, and accompanied by ocular symptoms, in which tear film instability and hyperosmolarity, ocular surface inflammation and damage, and neurosensory abnormalities play etiologic roles” [12]. It is estimated that 5% to 42% of the population suffers from DED, with subjective symptoms occurring in up to 50% [13-15]. Age is one of the main risk factors for DED. In the Beaver Dam Offspring Study (BOSS), dry eye symptoms were reported in 5-30% of older adults. The prevalence of DED was 8.4% in individuals under 60 years of age, 15% in those aged 70 to 79, and 20% in those over 80 [16]. In elderly individuals, the primary cause of DED is atrophy of the meibomian glands, leading to chronic inflammation of the ocular surface [17]. Advanced age is also a significant factor in the development of cataract, which remains the leading cause of reversible blindness in individuals aged 50 and older, with 15.2 million cases worldwide in 2020 [18].
There is no single, objective tool for diagnosing DED. TFOS DEWS II introduced a framework emphasizing the importance of both subjective symptoms and objective parameters. Symptoms can be evaluated using the Ocular Surface Disease Index (OSDI) or the 5-Item Dry Eye Questionnaire (DEQ-5). Objective parameters include the assessment of tear break-up time (TBUT), measurement of tear film osmolarity, and ocular surface staining. DED is diagnosed when a patient reports subjective symptoms and at least one objective diagnostic test yields a positive result [19]. The same criteria are included in the guidelines of the Polish Society of Ophthalmology (PTO).
Numerous studies confirm an increase in the severity of DED symptoms after cataract surgery [20, 21]. The impact of ocular surface disorders on the accuracy of preoperative biometric measurements and refractive outcomes following surgery is not fully understood. The aim of this study was to assess the link between DED and refractive errors after cataract surgery.
Material and methods
The study involved patients who underwent cataract surgery in 2022/2023. Fifty individuals were examined, with 22 excluded from the study due to factors affecting postoperative refraction outcomes, such as axial length of the eye < 21.5 mm or > 26 mm, pre-existing ocular surface disease, use of eye drops within two weeks prior to examination, or the need to use other drops during the preoperative period. The study included 28 participants undergoing cataract surgery (12 women and 16 men). The mean age of the participants was 71.25 years.
After obtaining the patients’ informed consent during the cataract surgery eligibility assessment visit, initial tests were conducted. Visual acuity was evaluated using Snellen charts, and DED screening was done according to the TFOS DEWS II criteria [19]. The diagnostic criteria for DED are outlined in Table I.
Table I
Criteria for diagnosing dry eye syndrome based on TFOS DEWS II guidelines
Subjective assessment of symptoms was conducted using the OSDI questionnaire. Tear film osmolarity was examined using the I-PEN device (I-Med Pharma, Canada). Corneal staining with fluorescein and TBUT measurement were performed. Patients diagnosed with dry eye disease formed the study group (n = 13), while the remaining patients comprised the control group (n = 15). The groups showed no statistically significant differences in terms of sex, age, operated eye, or visual acuity and refraction measurements both before and after the procedure. The demographic characteristics of both the study and control groups are shown in Table II.
Table II
Demographic characteristics of patients in the study group (group A) and the control group (group B). No significant differences between the groups were found
[i] BCVA – best-corrected visual acuity; MAE I – mean absolute error in the first measurement; MAE II – mean absolute error in the second measurement; M – mean; Me – median; Min – minimum value; Max – maximum value; SD – standard deviation; p – level of statistical significance; t – Student’s t-test for independent samples; U – Mann-Whitney test.
The patients in the study group were treated for DED following the guidelines of the Polish Ophthalmological Society. They were instructed to instill trehalose-containing lubricating eye drops four times daily and to perform eyelid hygiene twice daily. The treatment was administered for two weeks leading up to admission for cataract surgery. In the control group, no interventions were carried out before surgery.
Prior to other procedures, biometry was performed in all patients using the IOL Master 500 (Zeiss, Germany). The power of the IOL was calculated using the Haigis formula. The examinations were conducted twice: once during the eligibility assessment visit and again on the day of the procedure. Cataract surgery was performed by a single operator. A monofocal spherical hydrophobic intraocular lens (Hoya iSert® 150) was implanted in all patients. One month after the procedure, visual acuity and postoperative refraction were assessed, and the refractive error was calculated.
Statistical analysis
The obtained results were analyzed statistically using Statistica 13.3 (StatSoft, Poland). The analyzed quantitative variables were expressed as the mean and median values, lower and upper quartiles, minimum and maximum, and standard deviations, while the qualitative variables were presented as counts and percentages. The χ2 test was used to evaluate the relationships between qualitative variables. The normality of variable distribution in the study and control groups was assessed using the Shapiro-Wilk test. The Student’s t-test was used to examine differences between groups, while the Mann-Whitney test was applied when the conditions for the t-test were not met. Differences between measurements taken during the eligibility assessment visit and on the day of surgery were analyzed using the Student’s t-test for dependent samples. When the assumptions for the t-test were not met, the Wilcoxon signed-rank test was applied. A significance threshold of p < 0.05 was applied.
Results
During the eligibility assessment visit, 13 individuals (46.43%) were diagnosed with dry eye disease. In this group, significantly higher results were obtained in the OSDI questionnaire (24.62 vs. 8.00, p < 0.01), tear osmolarity in the operated eye (301.85 vs. 290.53, p = 0.038), and the degree of corneal surface staining in the operated eye (grades II and III according to the Oxford scale: 30.77% vs. 13.33%, p = 0.004). The results of the diagnostic tests for the study and control groups are presented in Table III. All patients underwent cataract surgery without any complications.
Table III
Comparison of diagnostic test results between the study group (group A) and the control group (group B). In the study group, significantly higher tear film osmolarity values were observed in the operated eye. Additionally, the severity of subjective symptoms evaluated using the OSDI questionnaire was significantly greater in this group
A significant improvement in visual acuity was achieved in both groups. In the study group, the mean BCVA was 0.32 ±0.18 before surgery and 0.82 ±0.30 after surgery (p < 0.01). In the control group, the mean BCVA before surgery was 0.42 ±0.14, and after surgery it was 0.96 ±0.07 (p = 0.000). There were no statistically significant differences between the groups in terms of BCVA prior to surgery (0.32 ±0.18 in the study group vs. 0.42 ±0.14 in the control group, p = 0.158). No significant differences in BCVA were observed post-surgery (0.82 ±0.30 vs. 0.96 ±0.07, p = 0.344). No significant differences were found in the biometric measurements – including keratometry (K1, K2), axial length (AL), and anterior chamber depth (ACD) – in any of the groups.
Mean absolute error (MAE) was calculated for measurements taken at the eligibility assessment visit and immediately prior to surgery (Figures 1, 2). In the control group, the MAE did not differ significantly between the two measurements (±0.26 vs. ±0.25, p = 0.882). In the study group, a significant reduction in MAE was observed after the treatment of dry eye disease (0.373 vs. 0.231, p = 0.036). The results are shown in Tables IV and V.
Figure 1
Postoperative refractive error (MAE) ranges determined based on the examination results obtained immediately prior to surgery in the study group
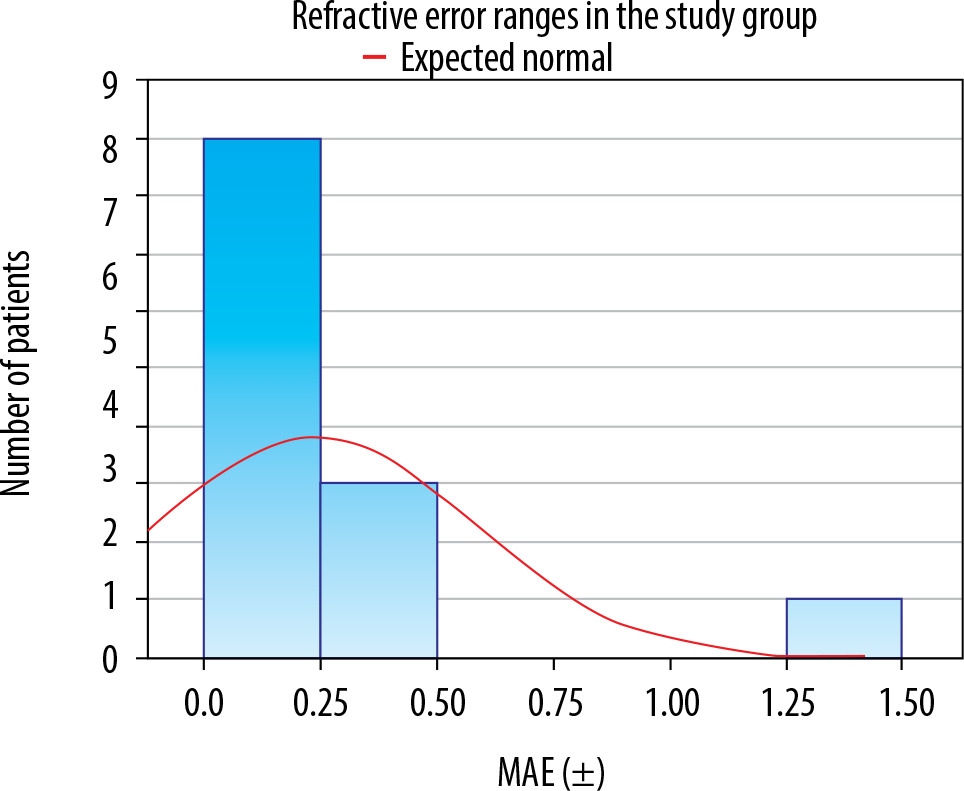
Figure 2
Postoperative refractive error (MAE) ranges determined based on the examination results obtained immediately prior to surgery in the control group
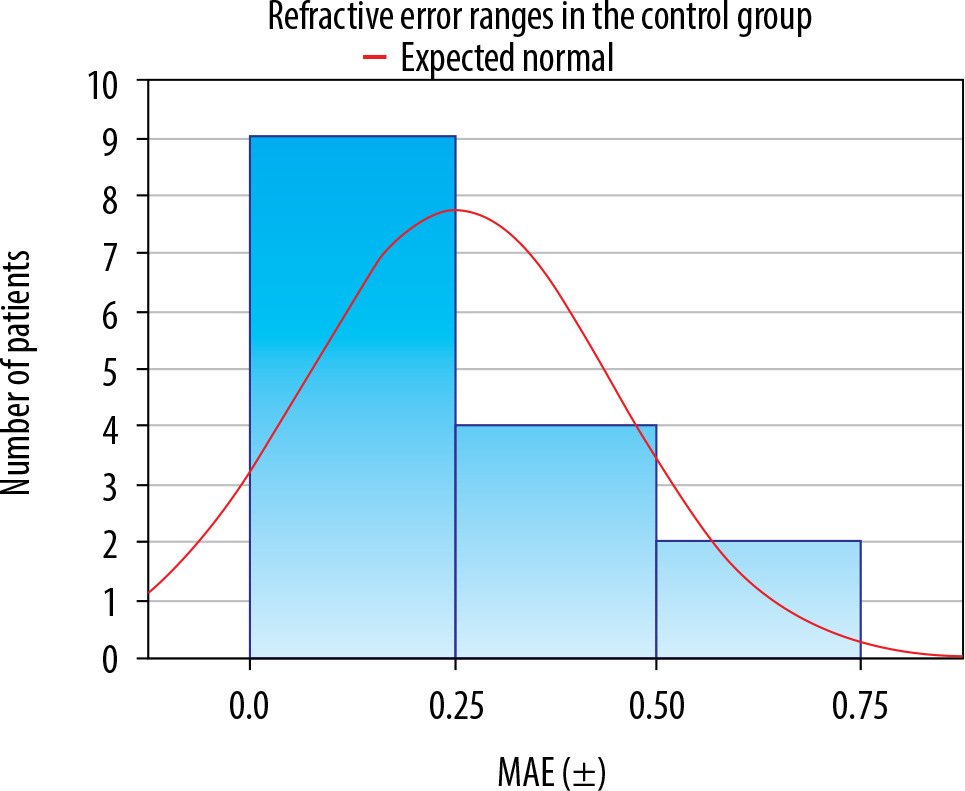
Table IV
Comparison of biometric test results and refractive errors recorded during the eligibility assessment visit (visit I), immediately prior to surgery (visit II), and one month post-surgery (visit III) in the study group. No statistically significant differences were observed in the individual biometric measurements. A significant improvement in visual acuity was noted following the surgery. Also, a significant reduction in refractive error was observed in the measurement taken immediately before surgery, following the treatment of DED
[i] K1, K2 – keratometry; ACD – anterior chamber depth; AL – axial length; BCVA – best-corrected visual acuity; MAE – mean absolute error; M – mean; Me – median; Min – minimum value; Max – maximum value; SD – standard deviation; p – level of statistical significance; t – Student’s t-test for dependent samples; Z – Wilcoxon signed-rank test.
Table V
Comparison of biometric test results and refractive error recorded during the eligibility assessment visit (visit I), immediately prior to surgery (visit II), and one month post-surgery (visit III) in the control group. No statistically significant differences were observed in the individual biometric measurements. A significant improve- ment in visual acuity was noted following the surgery
[i] K1, K2 – keratometry; ACD – anterior chamber depth; AL – axial length; BCVA – best-corrected visual acuity; MAE – mean absolute error; M – Mean; Me – median; Min – minimum value; Max – maximum value; SD – standard deviation; p – level of statistical significance; t – Student’s t-test for dependent samples; Z – Wilcoxon signed-rank test.
In both groups, a satisfactory percentage of MAE within the ±0.25 D and ±0.50 D range was identified. In the study group, 92.31% of patients achieved the MAE within ±0.75 D, while in the control group, this result was observed in all patients (100%). It needs to be noted that in the study group one patient had a significant postoperative refractive error (–1.28 D, 8%). Importantly, the patient’s preoperative refraction was –6.50 D spherical equivalent. The results are listed in Table VI.
Table VI
Comparison of mean absolute error (MAE) from biometric measurements taken at the eligibility assessment visit and on the day of surgery in the study and control groups. A statistically significant reduction in MEA was observed in the study group after treatment for DED. Although an increase in the percentage of patients with results within the ±0.25, ±0.50, and ±0.75, ranges was noted, statistical significance was not reached. No statistically significant changes were found in the control group
Due to the small group sizes, correlation calculations were not performed.
Discussion
The importance of managing dry eye disease before cataract surgery is increasingly highlighted in published guidelines. The Polish Ophthalmological Society in its Guidelines for perioperative care in cataract surgery in Poland (available at https://www.pto.com.pl) suggests considering treatment of clinically significant blepharitis and associated dry eye disease in patients before performing biometric measurements. The American Academy of Ophthalmology (AAO) emphasizes the importance of examining the eyelids, eyelashes, lacrimal apparatus, and orbits, as well as assessing tear function, particularly in elderly patients, before cataract surgery [22]. The American Society of Cataract and Refractive Surgery (ASCRS) goes a step further by recommending dry eye disease testing during the patient’s eligibility assessment visit, two weeks prior to scheduled refractive surgery. If significant ocular surface abnormalities are observed, the ASCRS recommends postponing the procedure until the patient’s condition stabilizes [23].
Among the patients included in the study, the prevalence of dry eye disease was found to be 46%. Additionally, in the asymptomatic (control) group, seven patients (47%) had a positive result in one of the additional tests (staining, TBUT, osmolarity), while one patient (7%) had a positive result in two of these three tests. This aligns with findings reported in previous studies. Gupta et al. found ocular surface disorders in 43.3% of individuals in a similar population. In the asymptomatic group, 85% of patients had a positive result in at least one objective test, including tear osmolarity and matrix metalloproteinase 9 (MMP-9) [24]. In the PHACO study conducted by Trattler et al., 22% of patients undergoing assessment of eligibility for cataract surgery had a prior diagnosis of dry eye disease. Interestingly, objective signs of the disorder were considerably more prevalent: 80% of patients exhibited a shortened TBUT of < 7 s, 50% showed central corneal staining, and 46.6% had a Schirmer test result of <10 mm [25]. Thus, it can be concluded that the issue of dry eye disease in patients undergoing cataract surgery is likely underestimated.
The refractive outcome of cataract surgery is influenced by various factors. The most common sources of refractive errors include postoperative anterior chamber depth and the resulting effective lens position (35%), errors in measuring postoperative refraction (27%), inaccuracies in eye length measurement (17%), and incorrect corneal measurements (10%) [10]. Each of these factors is continuously optimized, among others, through the development of new calculation formulas and advancements in biometry and keratometry techniques.
The impact of DED on the refractive outcomes of cataract surgery has not been extensively studied. Doga et al. assessed the refractive effect in a group of 17 patients with DED who were treated with 0.1% dexamethasone for two weeks prior to cataract surgery. In the study, 41.2% of patients achieved a postoperative refraction within ±0.25 D; 76.5% within ±0.5 D, and 100% within ±1 D. As a result, none of the patients studied exhibited a significant refractive error. However, it is important to note that the authors did not compare their results to a control group, so the true impact of ocular surface disorders on the outcomes remains unclear [26].
Kim et al. compared the results obtained for 53 patients with DED, treated with 0.5% loteprednol and 0.05% cyclosporine A for two weeks before cataract surgery, with a control group of 52 individuals. MAE in the treated group decreased from 0.38 ±0.34 D before treatment to 0.24 ±0.19 D, which was a statistically significant result [27].
Hovanesian et al. sought to optimize the treatment of dry eye disease in patients undergoing cataract surgery. The authors conducted two similar studies. One assessed the effects of treatment with 0.09% cyclosporine A for four weeks prior to cataract surgery in a group of 64 patients. The MAE was reduced from 0.39 ±0.30 D to 0.33 ±0.25 D, representing a statistically significant improvement [28]. The second study conducted by these authors involved the use of 5% lifitegrast in 83 patients for four weeks prior to scheduled cataract surgery. While MAE was not determined in this study, an increase in the percentage of eyes with refractive errors of ±0.25 D, ±0.50 D and ±0.75 D was observed, with each result being statistically significant [29]. In the present study, we obtained similar parameters; however, the small sample size prevented the confirmation of statistical significance. A comparison of these results with our findings is presented in Table VII.
Table VII
Comparison of mean absolute error (MAE) in the group of patients treated for DED, based on measurements taken before (I) and after treatment (II). The results obtained are consistent with previous studies
Our study also has several limitations, the most significant being the small sample size. Due to the limited number of participants, we were unable to assess the correlation between refractive errors and changes in keratometry and biometry parameters across both examinations. Also, we did not evaluate the effective lens position (ELP), a parameter whose role in refractive errors is becoming increasingly emphasized [30]. The duration of dry eye treatment was not adjusted based on additional follow-up examinations, nor was the effectiveness of the treatment assessed.
Research is ongoing, and the significant results obtained thus far confirm the potential usefulness of these findings.